Observability with OpenTelemetry
wasmCloud is designed to support cloud native observability standards using OpenTelemetry (OTEL). OpenTelemetry is an open source project defining common APIs and standards for telemetry in cloud native systems.
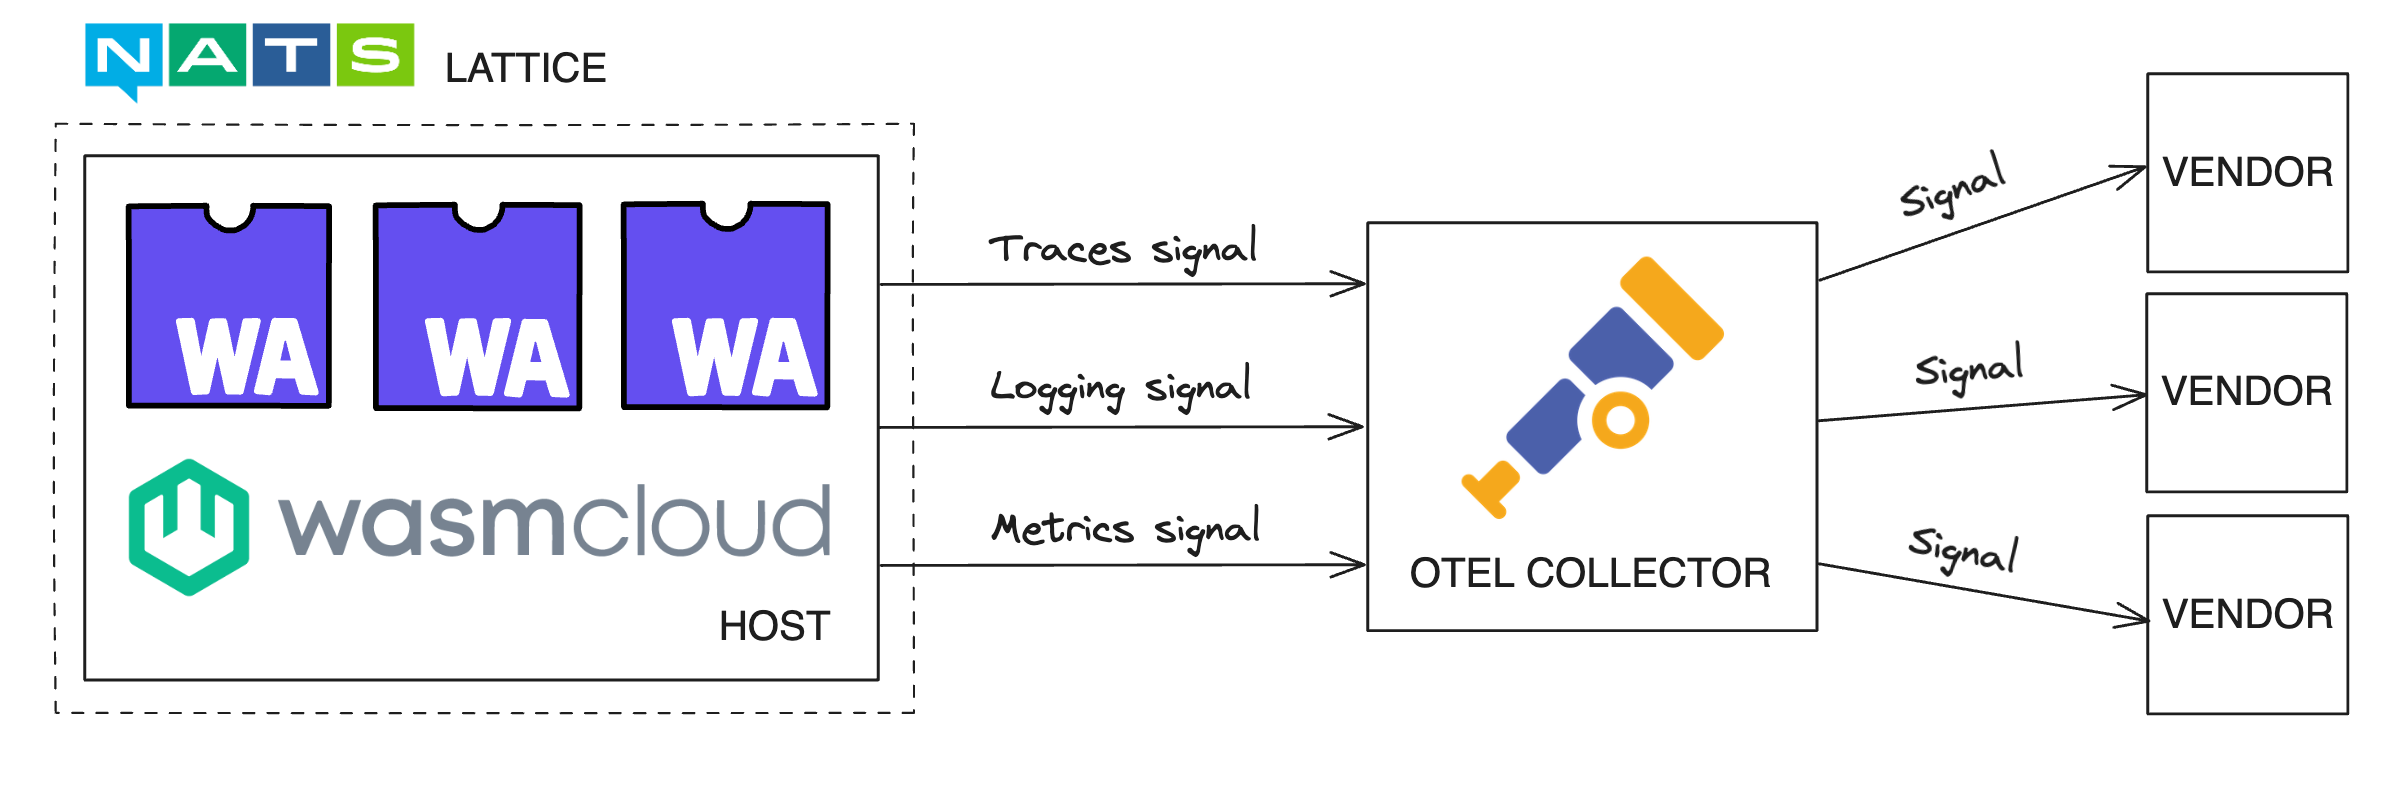
As of v1.0, wasmCloud emits traces, logs, and metrics as OTEL signals. The wasmCloud host uses the OpenTelemetry library, a push-based protocol that sends out signals for collection.
Why OpenTelemetry?
Standards-driven vendor-agnosticism is a pillar of wasmCloud's design philosophy: developers and operators should be able to swap out elements of their toolchains as needed. Using an industry standard like OpenTelemetry enables teams to pick and choose the OTEL-compatible vendors they want to use—moreover, teams can preserve historical data, reducing practical barriers to migration.
Data flow
A wasmCloud observability ecosystem must include an OTEL collector, a vendor-agnostic application from the OpenTelemetry project that processes and routes signals. The wasmCloud host emits signals to the OTEL collector, which passes the data on to observability systems such as Grafana—the collector can route signals to one or multiple processing systems for logs, traces, and metrics.
The OTEL documentation provides detailed instructions on how to install and run the OTEL collector. Additionally, you can find a sample configuration for an OTEL collector in the wasmCloud observability ecosystem demo on GitHub.
While the OTEL collector is the recommended point of configuration for complex signal routing, there are a set of core configurations available at the level of a wasmCloud host. The host can be configured using environment variables or host config flags.
Configuration
Enable the wasmCloud host to emit all OTEL signals with the WASMCLOUD_OBSERVABILITY_ENABLED environment variable:
WASMCLOUD_OBSERVABILITY_ENABLED="true"By default, OTEL signals are exported on port 4318, the standard HTTP/OpenTelemetry Protocol (otlp) port. wasmCloud only supports the otlp format. The endpoint for all otlp exports may be overwritten with the OTEL_EXPORTER_OTLP_ENDPOINT environment variable:
OTEL_EXPORTER_OTLP_ENDPOINT=http://my-custom-host:4318It is also possible to enable and overwrite endpoints for only specific signals—see the pages for traces, logs, and metrics for more details.
While these options are typically passed as part of host configuration, you can launch a wasmCloud observability ecosystem locally by passing environment variables to wash up:
WASMCLOUD_OBSERVABILITY_ENABLED="true" wash upLaunch a wasmCloud observability ecosystem
A set of sample configurations and Docker Compose files are available on GitHub. These samples can be used to launch an example wasmCloud observability ecosystem. Clone or download the wasmCloud repository:
git clone https://github.com/wasmCloud/wasmCloud.gitChange directory to examples/docker:
cd wasmcloud/examples/dockerRun the docker-compose-otel.yml file to launch...
- Grafana for dashboards
- The OTEL collector for ingesting OTLP signals from the wasmcloud host
- Tempo for processing traces and passing them to Grafana
- Loki for processing logs and passing them to Grafana
- Prometheus for metrics (wasmCloud metrics support still in development)
docker compose -f docker-compose-otel.yml upMake sure a wasmCloud host is running locally with OTEL signals enabled:
WASMCLOUD_OBSERVABILITY_ENABLED="true" wash upNow you can access Grafana's "Explore" interface at http://localhost:5050/explore.
OTEL-compatible tooling and vendors
The following tools and vendors process logs, metrics, and traces with support for the OpenTelemetry standard:
- Grafana Stack (Composable open source stack)
- Loki (Logs)
- Prometheus (Metrics)
- Tempo (Traces)
- AWS Distro for OpenTelemetry
- Datadog
- Dynatrace
- Elastic
- Honeycomb
- New Relic
- Splunk
- Many more—any vendor with OpenTelemetry compatibility is supported
Advanced options
Because wasmCloud's implementation of OpenTelemetry observability uses upstream OTEL libraries, a variety of advanced configuration options are available via environment variables defined in the upstream OTEL SDK and OTLP Exporter SDK.
For example, users have several options for trace sampling and log batch management. Not all upstream options are supported—for example, the wasmCloud host does not support changing format to gRPC.
In cases where the system receives conflicting configurations for the same option via environment variable and command line argument, upstream OpenTelemetry libraries prioritize configurations set via environment variable. Refer to the OpenTelemetry documentation for more details.
Further reading
Signal-specific options on the wasmCloud host are detailed on the traces, logs, and metrics pages. For more information on OpenTelemetry, refer to the project documentation.