Introducing the wasmCloud benchmark chart

As wasmCloud adoption has accelerated, we've seen an increased demand for more sophisticated benchmarking options. To fulfill this need, wasmCloud maintainer Taylor Thomas recently introduced a new wasmCloud benchmark Helm chart for users running wasmCloud on Kubernetes.
In this post, we'll explore how the chart works and demonstrate how to use it.
The need for speed (tests)
Robust benchmarking is important for enterprise wasmCloud users and wasmCloud contributors alike:
- Enterprises need to be able to evaluate platform performance.
- wasmCloud contributors need to be able to assess how their changes to the codebase affect performance.
The wasmCloud project is in the process of securing infrastructure hosted by the Cloud Native Computing Foundation (CNCF) for regular benchmarking on the project, since it's important to test in a stable, isolated, production-like environment.
In the meantime, users can try out the benchmark chart for themselves. The chart includes a self-contained observability and benchmarking stack that uses Grafana's open source k6 load-testing tool for the actual benchmarking:
- Grafana
- Loki
- Tempo
- Prometheus
- OpenTelemetry signal collectors
- k6 operator
The benchmark Helm chart makes it easy to install (and uninstall) this stack at the push of a button.
Deploying the benchmark chart
To test the chart, you'll first need a Kubernetes cluster with wasmCloud deployed on it. You can get wasmCloud running on a local kind cluster following the Kubernetes guide in the wasmCloud documentation.
Once you've got a Kubernetes cluster with wasmCloud, deploy the hello-world application from the Kubernetes guide:
kubectl apply -f https://raw.githubusercontent.com/wasmCloud/wasmcloud-operator/main/examples/quickstart/hello-world-application.yamlTo install the benchmark chart:
helm upgrade --install my-benchmark --version 0.2.0 oci://ghcr.io/wasmcloud/charts/benchmark --wait --set test.url=http://hello-world:8000When you run this command, test.url is a required value that specifies a URL (accessible from within the Kubernetes cluster) that the benchmark will test against. Typically this will be a component with an HTTP service—the hello-world application will work just fine.
k6 load-testing works by simulating a given number of requests from a given number of virtual users. The default configuration is suitable for a production-grade environment; if you're testing out the installation and usage on something a little humbler (like a local kind cluster), you may want to modify the test via a values.yaml file. You can set criteria like arrival rate, test duration, and maximum virtual users:
test:
  scenarios:
    default:
      rate: 1000
      duration: "1m"
      preAllocatedVUs: 25
      maxVUs: 500
If you'd like to experiment with k6 on its own in a local environment, the k6 dashboard is a fantastic tool.
Once the benchmark chart is successfully installed, the tests will start automatically. Running this command will let you know when tests are complete:
kubectl wait -n default --timeout 90s --for=jsonpath='{.status.stage}'=finished testruns/my-benchmark-testYou can get the logs and output of the test by running:
kubectl logs -n default -l k6_cr=my-benchmark-test,runner=true --tail=-1Each test outputs a ConfigMap (named after the test pod) with a key named results—this is a JSON object containing the summary results. To get a JSON array of the results:
kubectl get cm -n default -o json -l chart-revision=1,k6-result=true,k6-test-name=my-benchmark-test | jq '[.items[].data.results | fromjson ]'With results in a JSON array, users can go on to process and store the result data in whatever way makes sense for their needs.
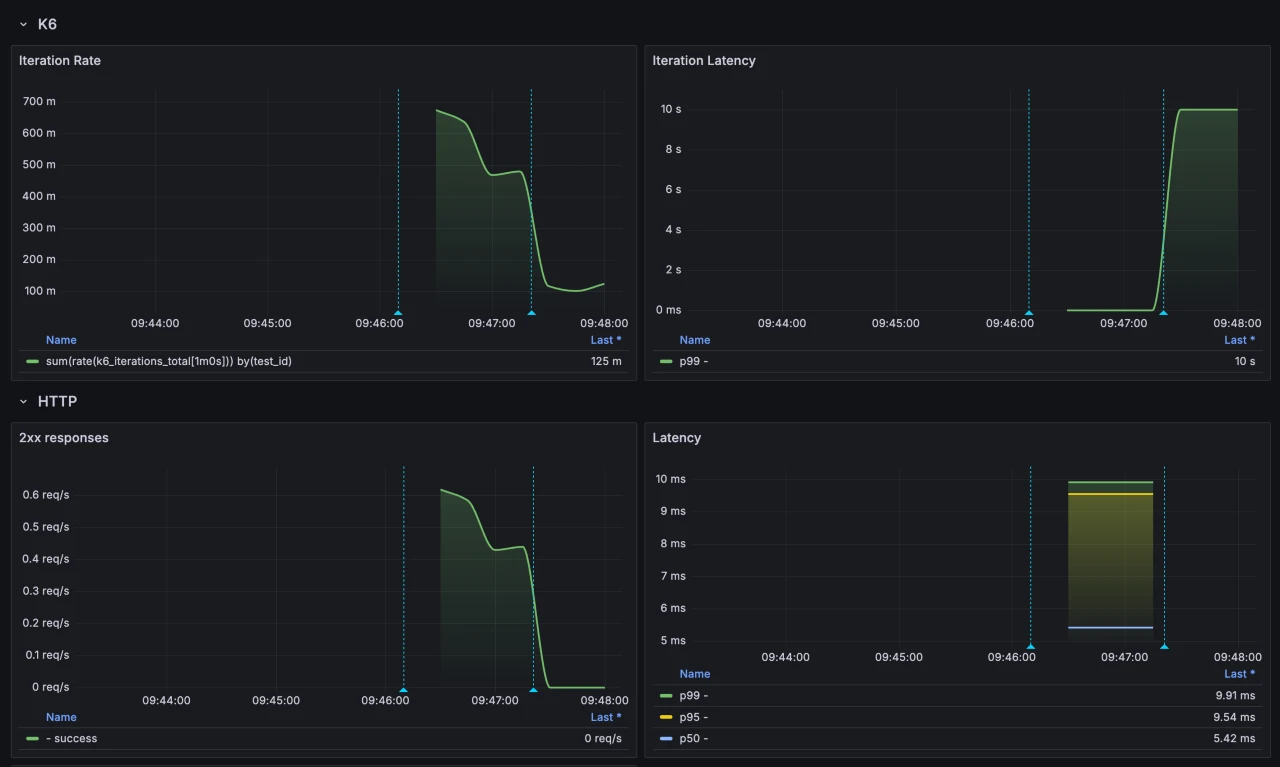
To view dashboards during or after your tests, you can port-forward to the chart's Grafana instance:
kubectl port-forward -n default svc/my-benchmark-grafana 3000:80Then open http://localhost:3000 in your browser and navigate to the "Test Environment" dashboard in the dashboards section.
When you're done, you can clear the test results by running:
kubectl delete cm -n default -l k6-result=true,k6-test-name=my-benchmark-testFor advanced options, see the chart's GitHub repo.
Next steps
The benchmark chart is a rapidly developing project—watch the GitHub repo for new developments in the chart—and dedicated benchmarking infra—in the near future.
If you'd like to learn more about benchmarking with wasmCloud or get involved with the project, join us in the wasmCloud Slack or at a wasmCloud community meeting. We'd love to hear your thoughts on how we can make benchmarking even better!